Post-Deployment Verification & Configuration
After successfully deploying all services to your cluster, you must perform some post-deployment verification and configuration tasks to make sure the DMS platform is up and running healthily.
- Check Docker services are running
- Check Ego API is running
- Check and configure Ego UI
- Check Song API is running
- Check Maestro API is running
- Check Elasticsearch is running
- Add project to Arranger UI
- Check Data Portal is running
The following sections below describe these tasks in detail.
Check Docker Services are Running
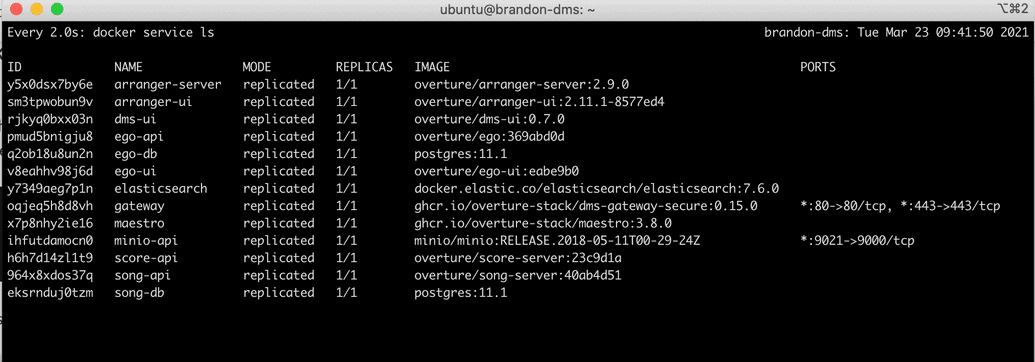
Although the Installer script indicates the deployment completed successfully, as a sanity check, make sure all Overture services have replicas running using this command:
$ docker service ls
All services should display with replicas indicating **1/1**:
The specific services you must check for are:
| Service / Container Name | Description |
|---|---|
| arranger-ui | Arranger administrative UI |
| arranger-server | Arranger backend server |
| dms-ui | DMS data portal |
| ego-api | Ego API |
| ego-db | Ego PostgreSQL database |
| ego-ui | Ego administrative UI |
| elasticsearch | Elasticsearch |
| gateway | DMS gateway / ingress controller |
| maestro | Maestro indexing service |
| minio-api | Only used if MinIo chosen as object storage service |
| score-api | Score API |
| song-api | Song API |
| song-db | Song PostgreSQL database |
Check Ego API is Running
Check that the Ego API is running by going to:
| Mode | URI |
|---|---|
| Local | http://localhost:<port>/ego-api/swagger-ui.html |
| Server | https://<myDomain>/ego-api/swagger-ui.html |
Where:
<port>is the port on which you have deployed the DMS Gateway in local mode<myDomain>is the registered domain you configured for the DMS Gateway (e.g.dms.test.cancercollaboratory.org)
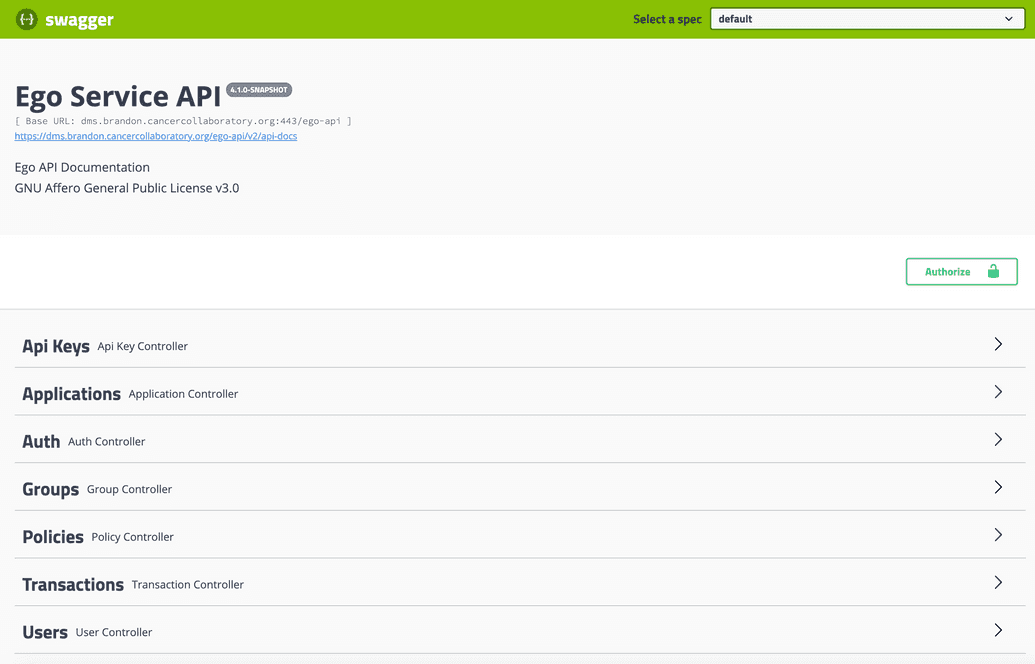
If running, the Swagger API will be accessible via your browser in graphical format:
Check and Configure Ego UI
Check Your Providers' Redirect URIs
Before logging into the Ego UI, you may wish to check again that all your identity providers have the correctd redirect URI configured in their developer console's OAUTH 2.0 settings. This was configured earlier when setting up your secrets, but double-checking is a good practice.
The redirect URI you must authorize can be found in that provider's Ego configuration section in the ~/.dms/config.yaml file. Look for the preEstablishedRedirectUri. In the example below, the
preEstablishedRedirectUri for Google is https://dms.test.cancercollaboratory.org:443/oauth/code/google
ego:api:tokenDurationDays: 30jwt:user:durationMs: 10800000app:durationMs: 10800000refreshTokenDurationMS: 43200000hostPort: 9000sso:google:clientId: "abc123"clientSecret: "abc123"preEstablishedRedirectUri: "https://dms.test.cancercollaboratory.org:443/oauth/code/google"
NOTE: When entering the domain in LinkedIn for server mode, you must append the port :443 to the end of the domain. The true redirect URI sent by the DMS actually contains :443 suffixed to the domain. While other identity providers ignore or drop this suffix, LinkedIn requires the redirect URI to match exactly, hence :443 must be explicitly entered.
Login and Configure Ego UI
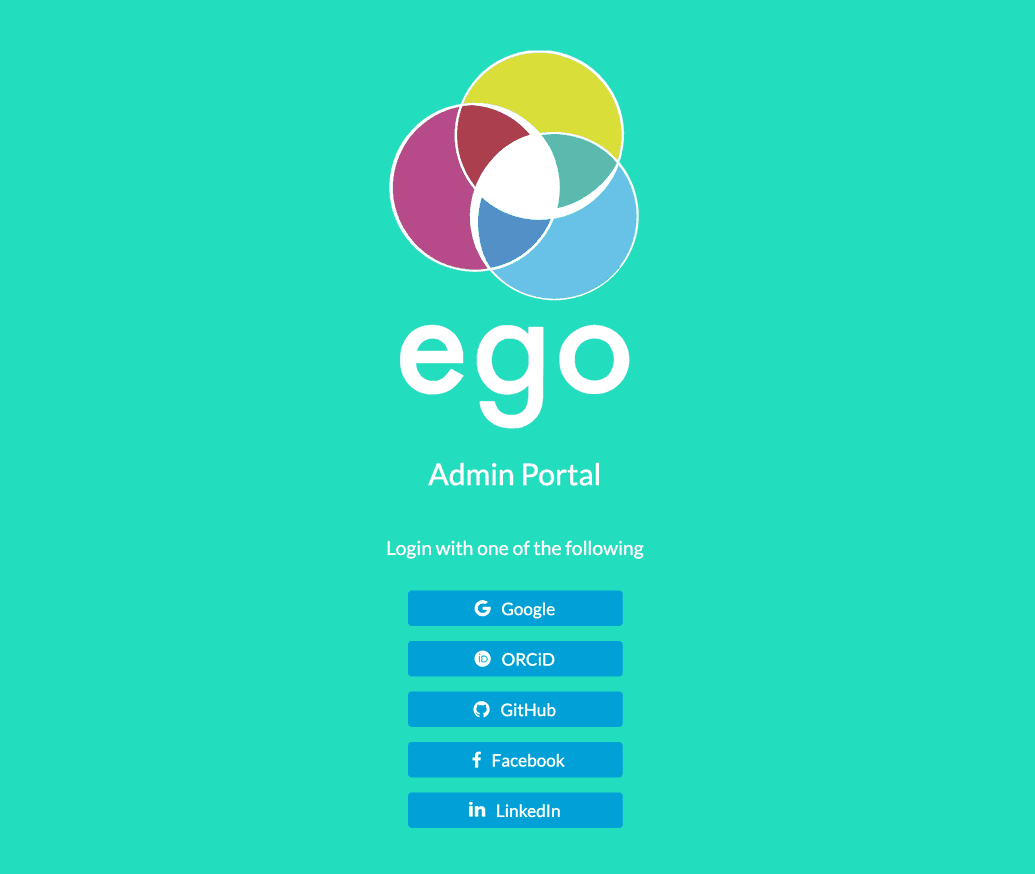
- Next, log in using one of the providers you setup in your configuration (e.g. Google) by going to:
| Mode | URI |
|---|---|
| Local | http://localhost:<port>/ego-ui |
| Server | https://<myDomain>/ego-ui |
Where:
<port>is the port on which you have deployed the DMS Gateway in local mode<myDomain>is the registered domain you configured for the DMS Gateway (e.g.dms.test.cancercollaboratory.org)
- Once logged in, the first user is automatically created and treated as an administrator.
NOTE: Subsequent users logging into Ego UI will NOT be automatically treated as administrators, for security precautions. It is then the responsibility of the first user (first admin) to assign an Admin role to other users as required.
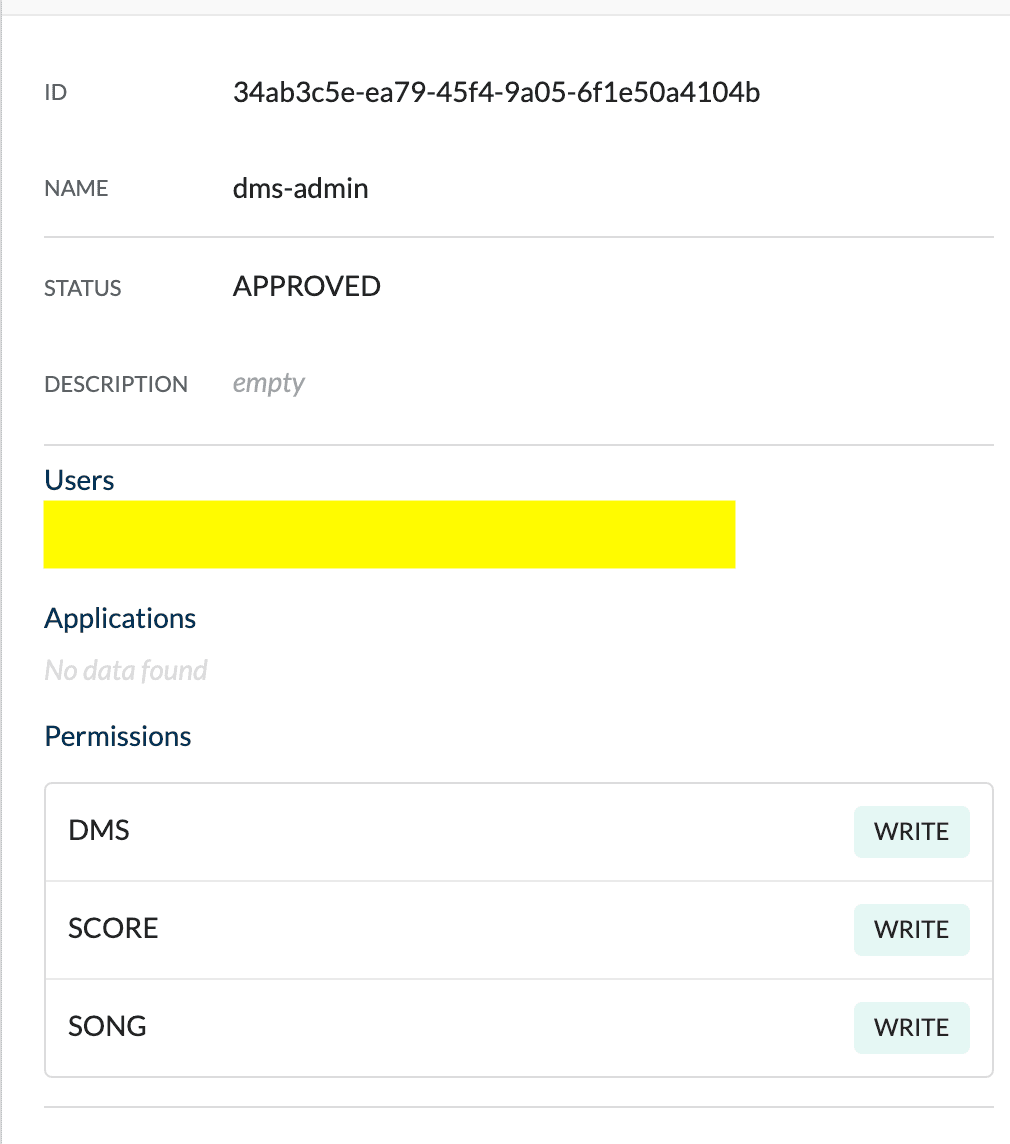
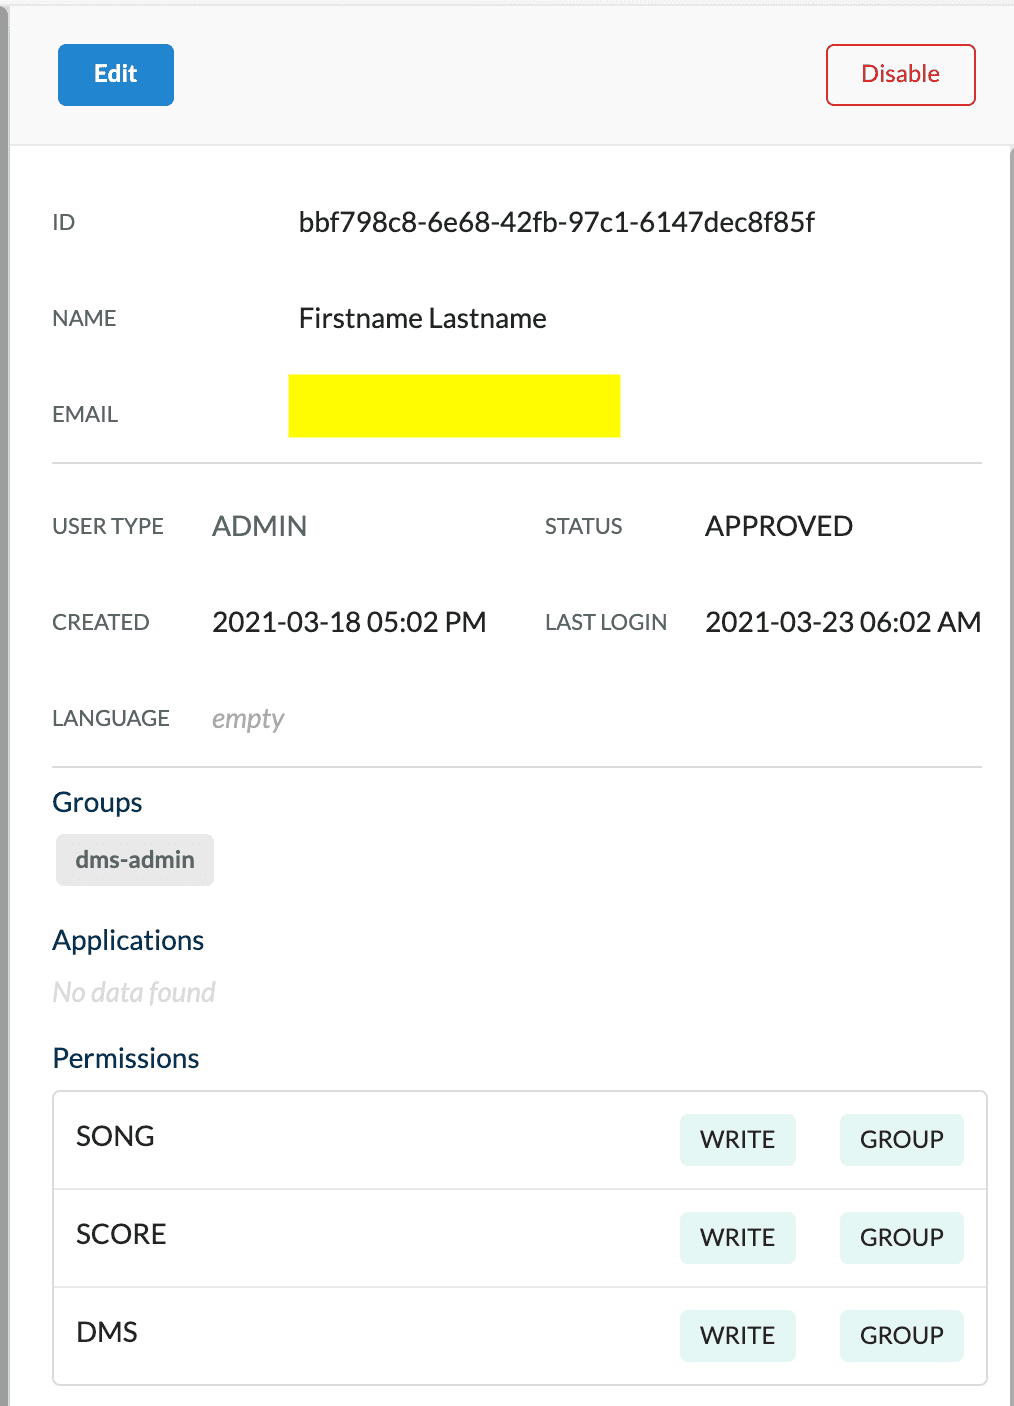
- From the left navigation, click Groups and verify that the
dms-admingroup has been automatically created and is assigned these permissions:DMS.WRITE,SONG.WRITE,SCORE.WRITE
- From the left navigation, click Users and verify that your user was created with USER TYPE =
ADMIN.
- Click Edit on your profile, then under Groups use the Add button to add yourself to the
dms-admingroup. This ensures your user can perform all basic actions required for a DMS administrator.
- Click Save. Here is an example of the resulting profile changes:
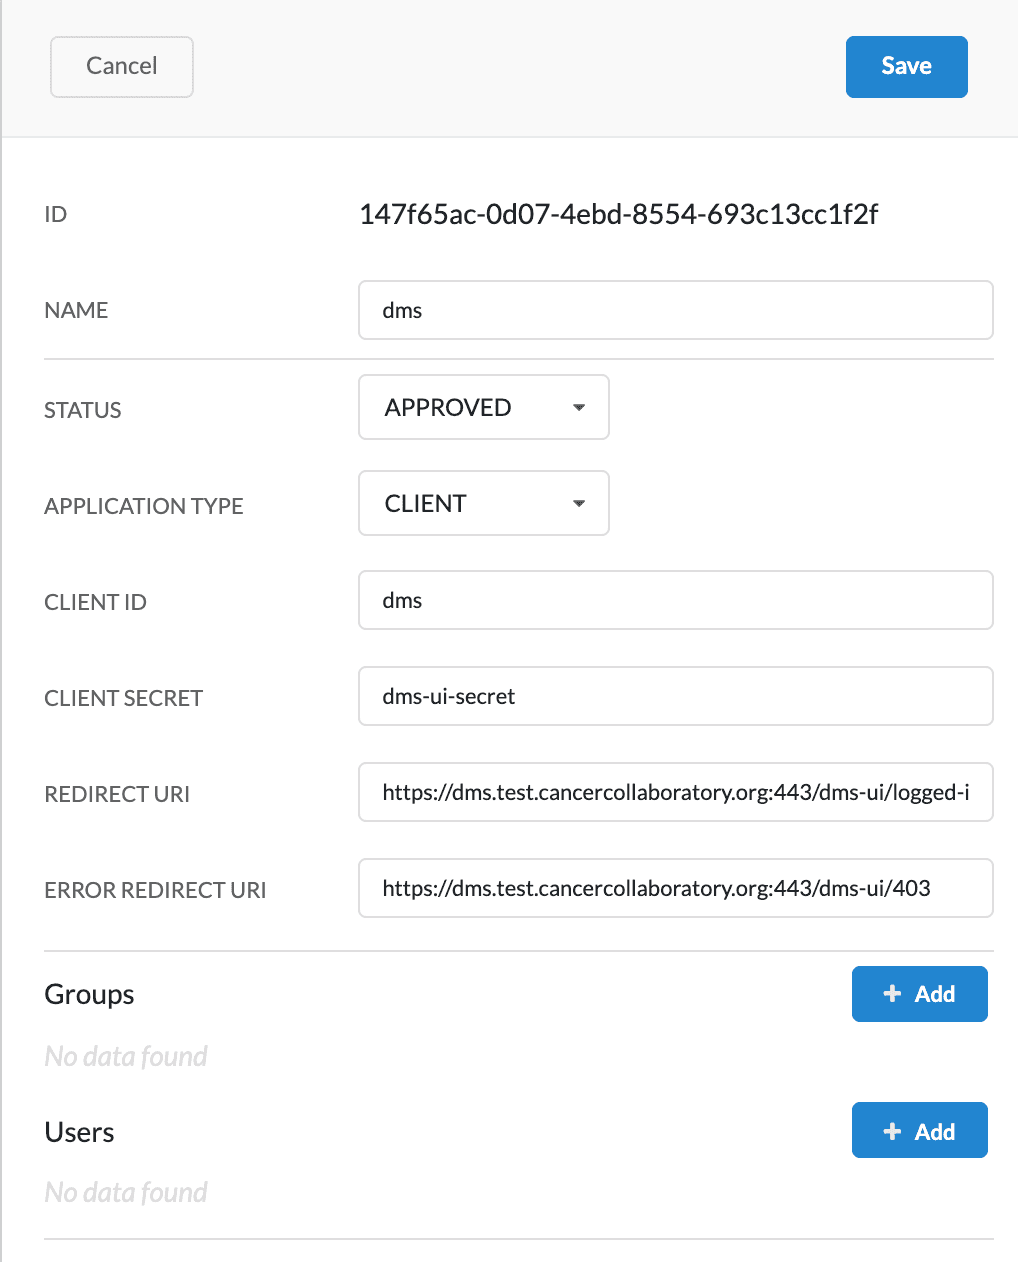
- From the left navigation, click Applications and verify that the
dmsapplication has been created.
- Click Edit on the
dmsapplication and in the ERROR REDIRECT URI field, enter:
| Mode | URI |
|---|---|
| Local | http://localhost:<port>/dms-ui/403 |
| Server | https://<myDomain>:443/dms-ui/403 |
Where:
<port>is the port on which you have deployed the DMS Gateway in local mode<myDomain>is the registered domain you configured for the DMS Gateway (e.g.dms.test.cancercollaboratory.org)
This ensures that when OAUTH errors occurs, the DMS UI (Data Portal) is routed to the correct error page to display to the end user.
- Click Save. Here is an example of the resulting application changes:
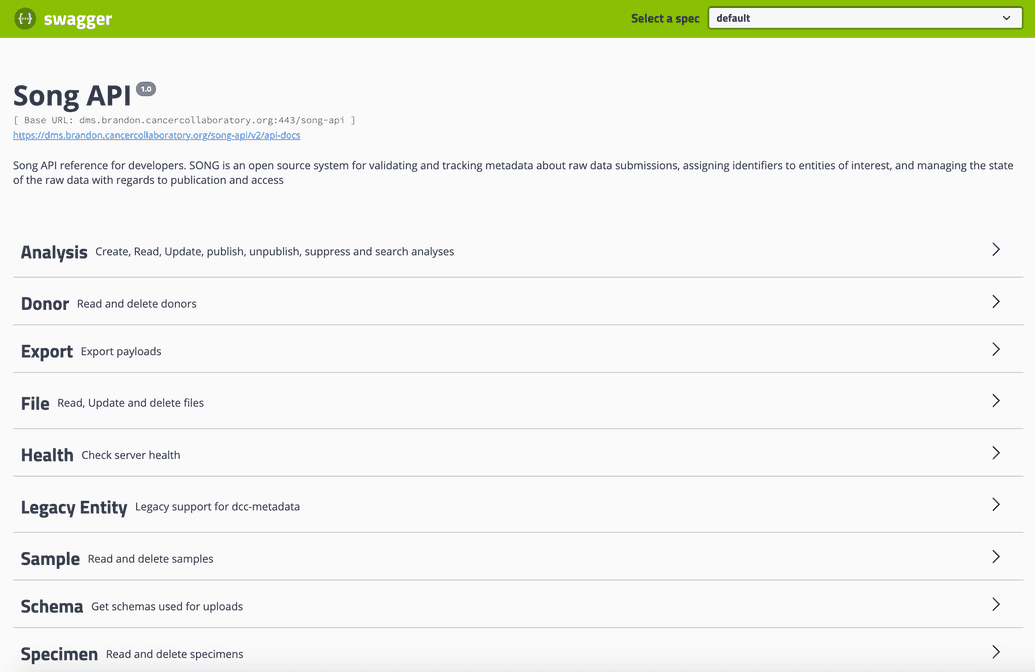
Check Song API is Running
Check that the Song API is running by going to:
| Mode | URI |
|---|---|
| Local | http://localhost:<port>/song-api/swagger-ui.html |
| Server | https://<myDomain>/song-api/swagger-ui.html |
Where:
<port>is the port on which you have deployed the DMS Gateway in local mode<myDomain>is the registered domain you configured for the DMS Gateway (e.g.dms.test.cancercollaboratory.org)
If running, the Swagger API will be accessible via your browser in graphical format:
Check MinIo is Running (Optional)
If you chose to use MinIo as your object storage service, check that the MinIo browser:
- Access the MinIo browser by going to:
| Mode | URI |
|---|---|
| Local | http://localhost:<port>/minio |
| Server | https://<myDomain>/minio |
Where:
<port>is the port on which you have deployed the DMS Gateway in local mode<myDomain>is the registered domain you configured for the DMS Gateway (e.g.dms.test.cancercollaboratory.org)
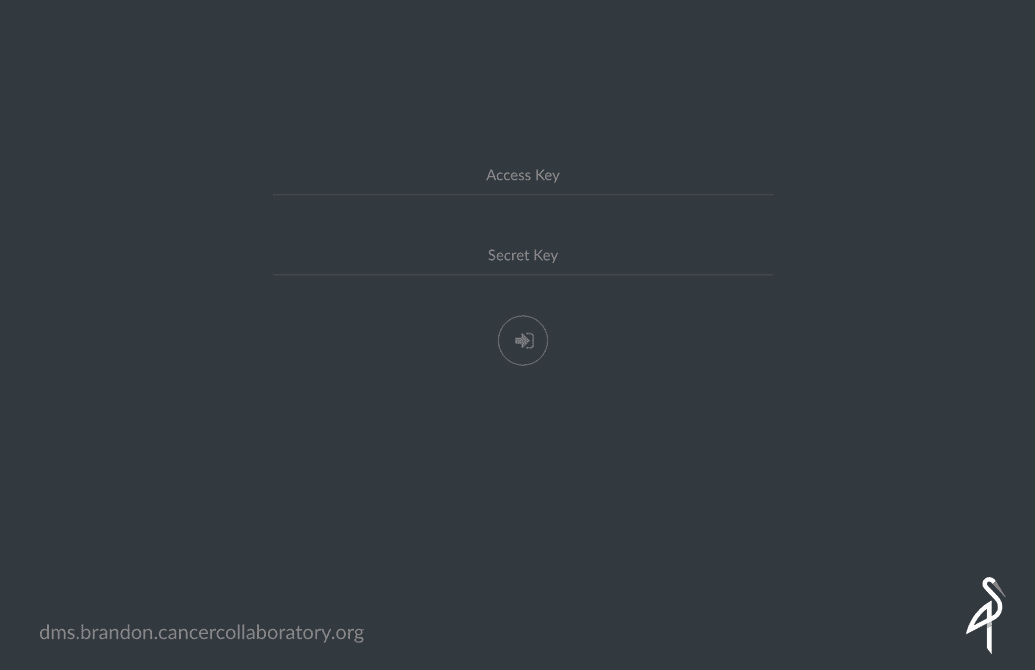
- Enter the
Access KeyandSecret Key. If you chose to provide your own credentials during configuration, then you should have recorded these earlier. Otherwise, if you chose for credentials to be auto-generated, you can view them by running thedms config getcommand or inspecting the~/.dms/config.yamlfile.
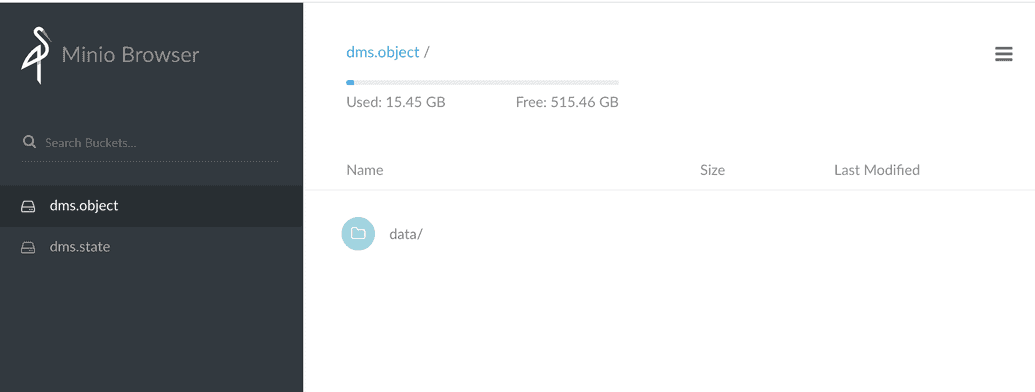
- Click the login button. Your buckets are displayed. Verify that the bucket IDs you specified during configuration have been created:
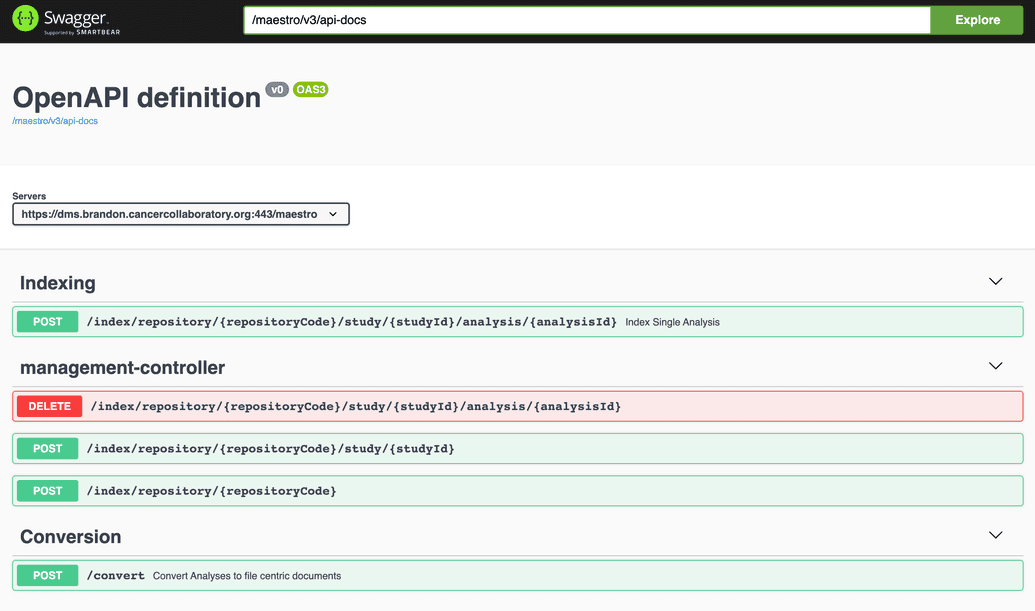
Check Maestro API is Running
Check that the Maestro API is running by going to:
| Mode | URI |
|---|---|
| Local | http://localhost:<port>/maestro/api-docs |
| Server | https://<myDomain>/maestro/api-docs |
Where:
<port>is the port on which you have deployed the DMS Gateway in local mode<myDomain>is the registered domain you configured for the DMS Gateway (e.g.dms.test.cancercollaboratory.org)
If running, the Swagger API will be accessible via your browser in graphical format:
Check Elasticsearch is Running
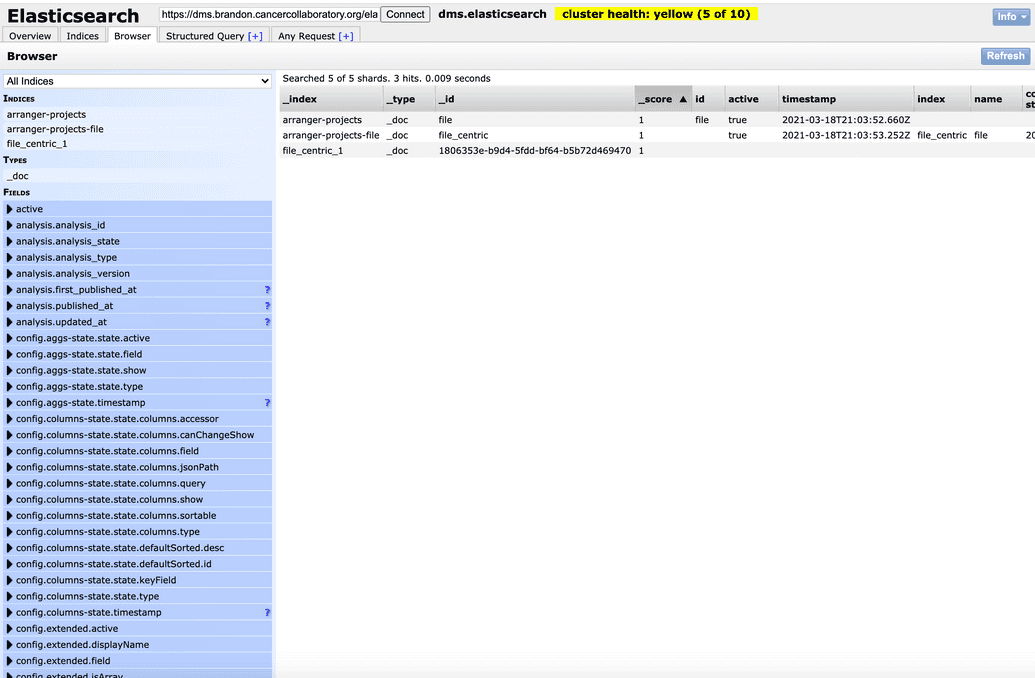
Check that Elasticsearch index is deployed by using a tool such as Elastic's own Kibana tool or browser plugin (e.g. Elastichead for Chrome or Elasticvue for Firefox) to graphically view the index.
Do the following:
- From your tool, connect to Elasticsearch by going to:
| Mode | URI |
|---|---|
| Local | http://localhost:<port>/elasticsearch |
| Server | https://<myDomain>/elasticsearch |
Where:
<port>is the port on which you have deployed the DMS Gateway in local mode<myDomain>is the registered domain you configured for the DMS Gateway (e.g.dms.test.cancercollaboratory.org)
Enter username
elasticand the password you provided during configuration.Browse the indices and check that the default index (default name
file_centric) is created and the base fields are present. For example, from the Chrome Elastichead plugin:
Add Project to Arranger UI
To enable the Data Portal to display indexed data, a project must be created in Arranger that the Portal can reference. The Arranger project will contain configurations and metadata that determine which data fields are displayed in the Portal and how.
Do the following:
- Check that the Arranger administrative UI is running by going to:
| Mode | URI |
|---|---|
| Local | http://localhost:<port>/arranger-ui/ |
| Server | https://<myDomain>/arranger-ui/ |
Where:
<port>is the port on which you have deployed the DMS Gateway in local mode<myDomain>is the registered domain you configured for the DMS Gateway (e.g.dms.test.cancercollaboratory.org)
- From the Project versions list, click Add Project:
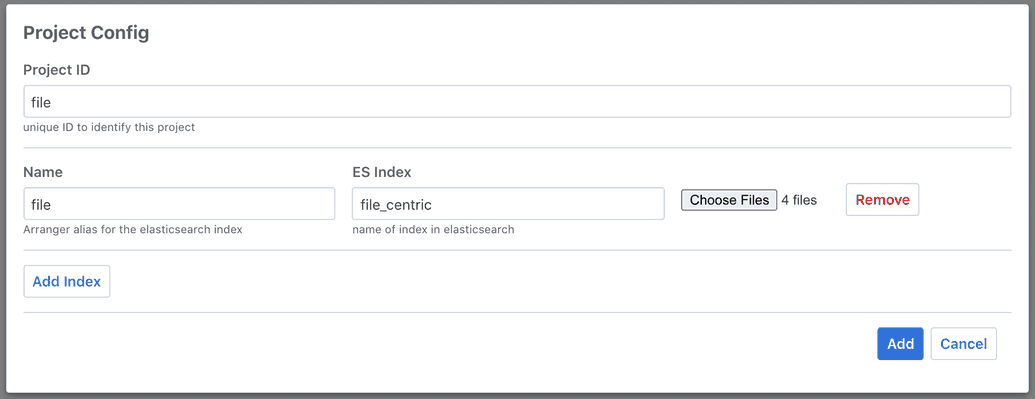
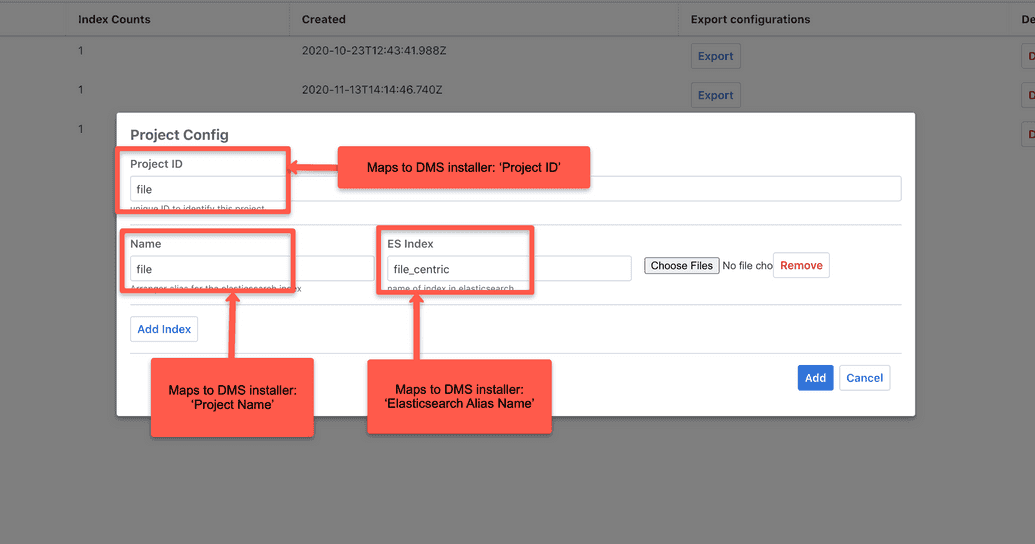
- A pop-up control appears. In the Project ID field, enter the exact same Project ID value that you specified in the DMS-UI section of the configuration questionnaire (default is
file). These MUST match.
- Under Project ID, click Add Index. Additional fields appear.
- In the Name field, enter the exact same Project Name value that you specified in the DMS-UI section of the configuration questionnaire (default
file). These MUST match.
- In the ES Index field, enter the Elasticsearch Alias Name value that you specified in the DMS-UI section of the configuration questionnaire (default
file_centric). These MUST match.
- In the ES Index field, enter the Elasticsearch Alias Name value that you specified in the DMS-UI section of the configuration questionnaire (default
- Click Choose Files, then browse for and select the four (4) JSON metadata files that define your project's default configuration in Arranger. These are the same files you setup earlier in the pre-quisite steps here:
aggs-state.jsoncolumns-state.jsonextended.jsonmatchbox-state.json
Demo samples of these files can be downloaded here.
- The configuration pop-up should now look like this:
As indicated, values used to create the project in the Arranger UI here MUST match the Project ID, Project Name, Elasticsearch Alias Name that you supplied earlier during the configuration script.
This screenshot shows how the Arranger UI fields map to the inputs in the DMS installation script:
- Click the Add button in the bottom right of the pop-up. Verify that your project is now created and has an entry (row) in the Project versions list:
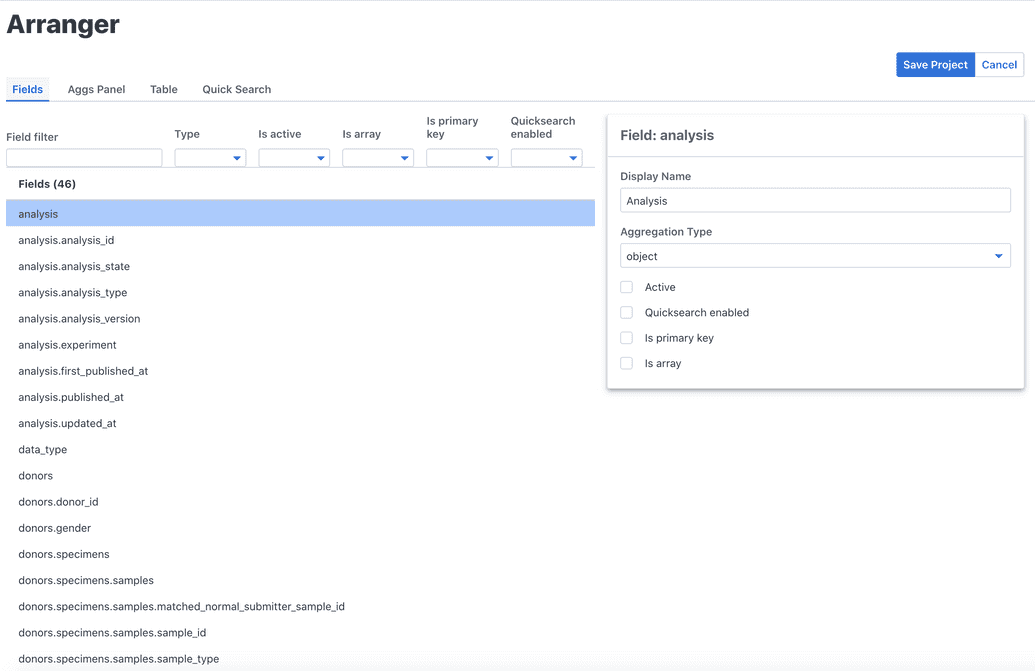
- You can click the Project ID to browse its configurations and make sure they match the metadata files you uploaded above:
Check Data Portal is Running
After adding your project to Arranger, check that the Data Portal (DMS UI) is running by going to:
| Mode | URI |
|---|---|
| Local | http://localhost:<port>/dms-ui |
| Server | https://<myDomain> |
Where:
<port>is the port on which you have deployed the DMS Gateway in local mode<myDomain>is the registered domain you configured for the DMS Gateway (e.g.dms.test.cancercollaboratory.org)
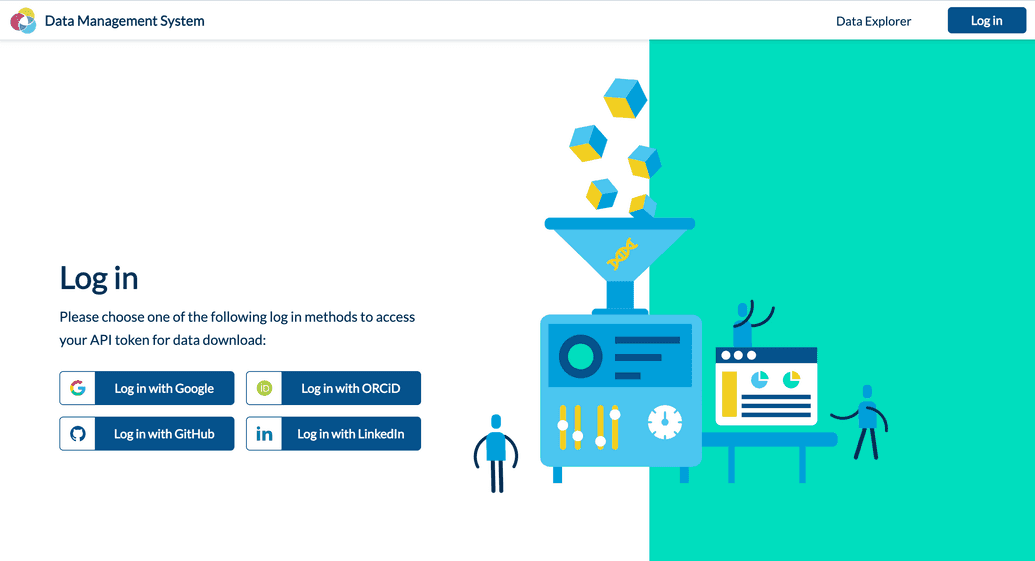
- Click Login, select one of the identity providers, and test that you can log into the Data Portal:
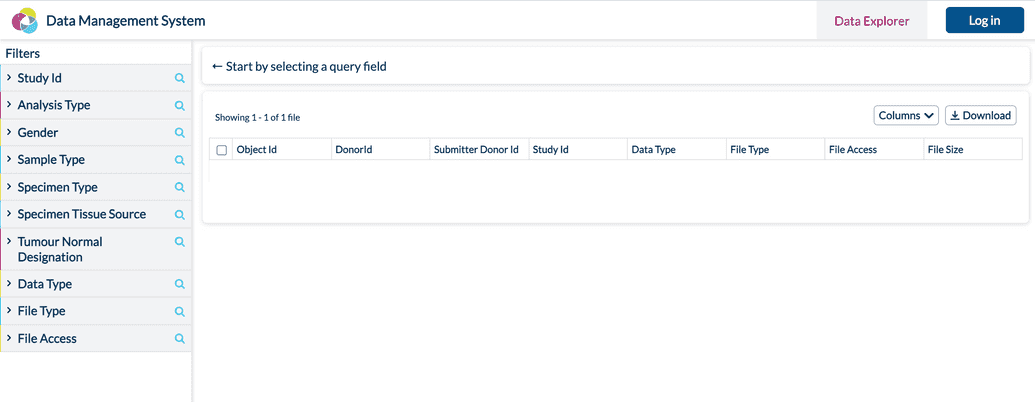
- Next, click Data Explorer and verify that page displays the filters in the left control panel and the columns in the results table, as described by your Arranger UI configuration. However, no data will be present at this point, since no actual data has been uploaded and indexed:
 Verification Complete
NOTE: This completes the verification of your DMS installation. The final step in preparing your DMS platform is to upload actual data to it for end user consumption. In the Test Data Upload Flow section, we will teach you how to populate the system with data using a simple demo example.
